The astounding ability of generative AI to search, retrieve & summarize data the user requires from raw information without any human intervention offers the possibility of it becoming a highly influential technology across various industries. One space where generative AI can make a significant difference in the test & measurement domain is simplifying the challenges of working with test data.
Semiconductor industries and other hi-tech industries dealing with a vast amount of data must ensure that the data collected from various sources are adequately analyzed and reported before drawing conclusions, making the “Measurement Data Analysis” process a long, arduous & manual in the project lifecycle. However, effective use of Generative AI for measurement data analysis offers the potential to simplify the entire process.
In this blog, let us course through the traditional workflow, identify bottlenecks, and discuss how generative AI can transform this landscape, making data analysis more efficient and insightful.
Conventional Measurement Data Analysis – Workflow & Challenges
The conventional measurement data analysis process is mostly manual. It starts from acquiring the data to generating a report with the analyzed data- understanding the entire process behind the report is crucial in drawing effective conclusions from the data.
The conventional method involves four key stages:
- Ingestion and Data Cleansing
- Extraction
- Analysis
- Reporting
Several challenges remain across the above stages in the conventional method.
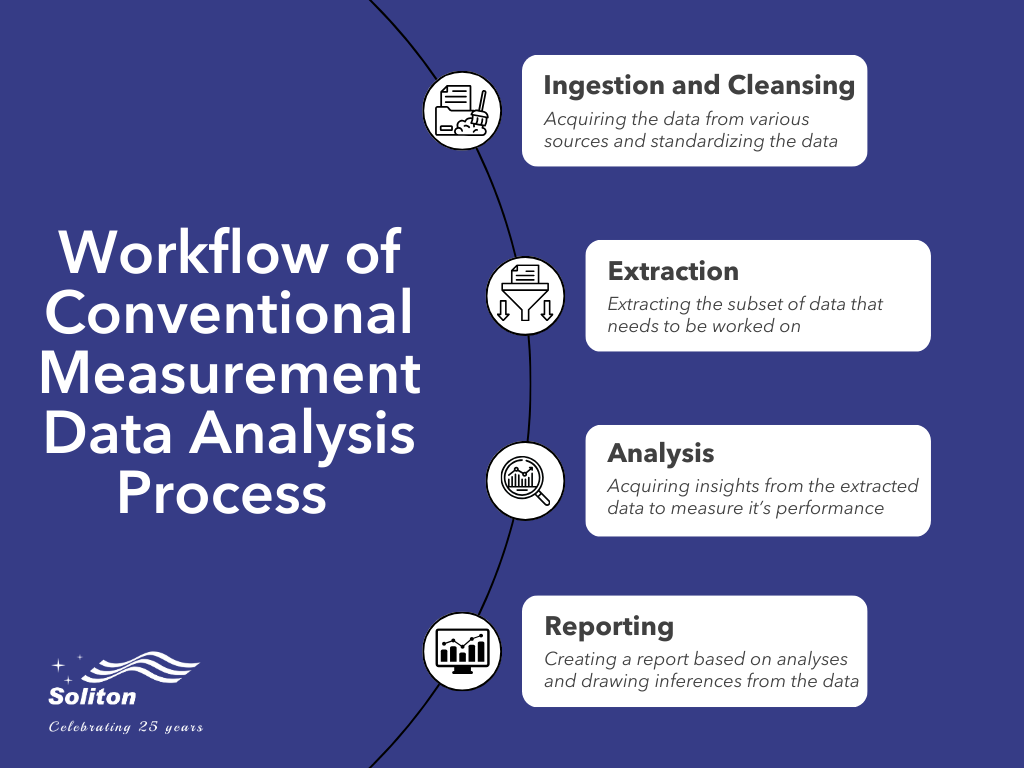 Workflow of Conventional Measurement Data Analysis
Ingestion and Cleansing: The first stage in the workflow is to acquire the data from various sources and set it up for processing in further steps. This data could be from multiple engineers, ventures, or disciplines such as simulation, design validation, and production tests.
One primary constraint is that this acquired data needs to be standardized, as engineers might use different tools to generate the data and different terminologies to represent the same data. For example, the “voltage” parameter might be expressed as “Vin” in simulation & “Voltage” in design validation.
With data represented differently, standardizing the data to represent them identically before ingesting them into data systems is a necessity. Doing so would help reduce the manual effort of writing complex queries for different conventions and help with the easy extraction of data. But even this process can be arduous and might demand considerable time and effort from engineers.
Extraction: After the data is acquired, an engineer’s task of extracting the data subset required for analysis is essential.
However, to extract a subset of data from the system, the engineer needs to have profound knowledge of what the data is, how to extract it, the application the data is stored, and all the tools needed to extract a particular data.
Analysis: The analysis part of the workflow deals with acquiring insights from the extracted data by drawing plots and creating statistics to measure the performance or usefulness of the data.
Numerous business intelligence (BI) tools exist in the market for visualizing the data. However, these BI tools are inadequate for engineering use cases, and a substantial amount of effort and time is demanded from customers to write custom code and develop algorithms that visualize the subset of data.
Reporting: The final stage of the workflow is to create a report (For Example: a PDF document or PowerPoint presentation) for formal closure & sharing. These reports summarize the analyses and draw necessary inferences to provide the meaning behind ingested, extracted, and analyzed data.
Like the challenges above, reporting is also a long, ardent manual process.
The task of ingesting the data, cleaning it, extracting, analyzing, and reporting it manually can be exhausting and tiring from the user’s perspective. Additionally, working on individual stages manually might render the data prone to errors which can lead to inaccurate inferences in the report.
How can LLM and Generative AI Simplify Measurement Data Analysis?
LLMs (Large Language Models) or generative AI models can be an ideal solution to the strenuous process of the typical workflow and the challenges associated with it.
Helping with Ingestion and Cleansing
Starting with the ingestion and data cleansing process, generative AI can act as an agent that can peep in and comprehend similar data in terms of their naming conventions and provide suggestions to the user for editing the data thereby nullifying the need for the user to go through bunches of data and lessening the scope of errors. This process can also be entirely automated, with high degrees of accuracy, over time.
Assisting in Data Extraction
LLMs can store vast amounts of information and detail relating to the data and system, that might come to the aid of the user. Moreover, they can be trained based on the user’s database and application, allowing data to be fetched with ease based on the user’s request.
Below are a few screenshots from a custom AI application, Vina, developed by Soliton providing statistics, infographics, data visualizations, and generating reports from our internal data for easy inference based on user query.
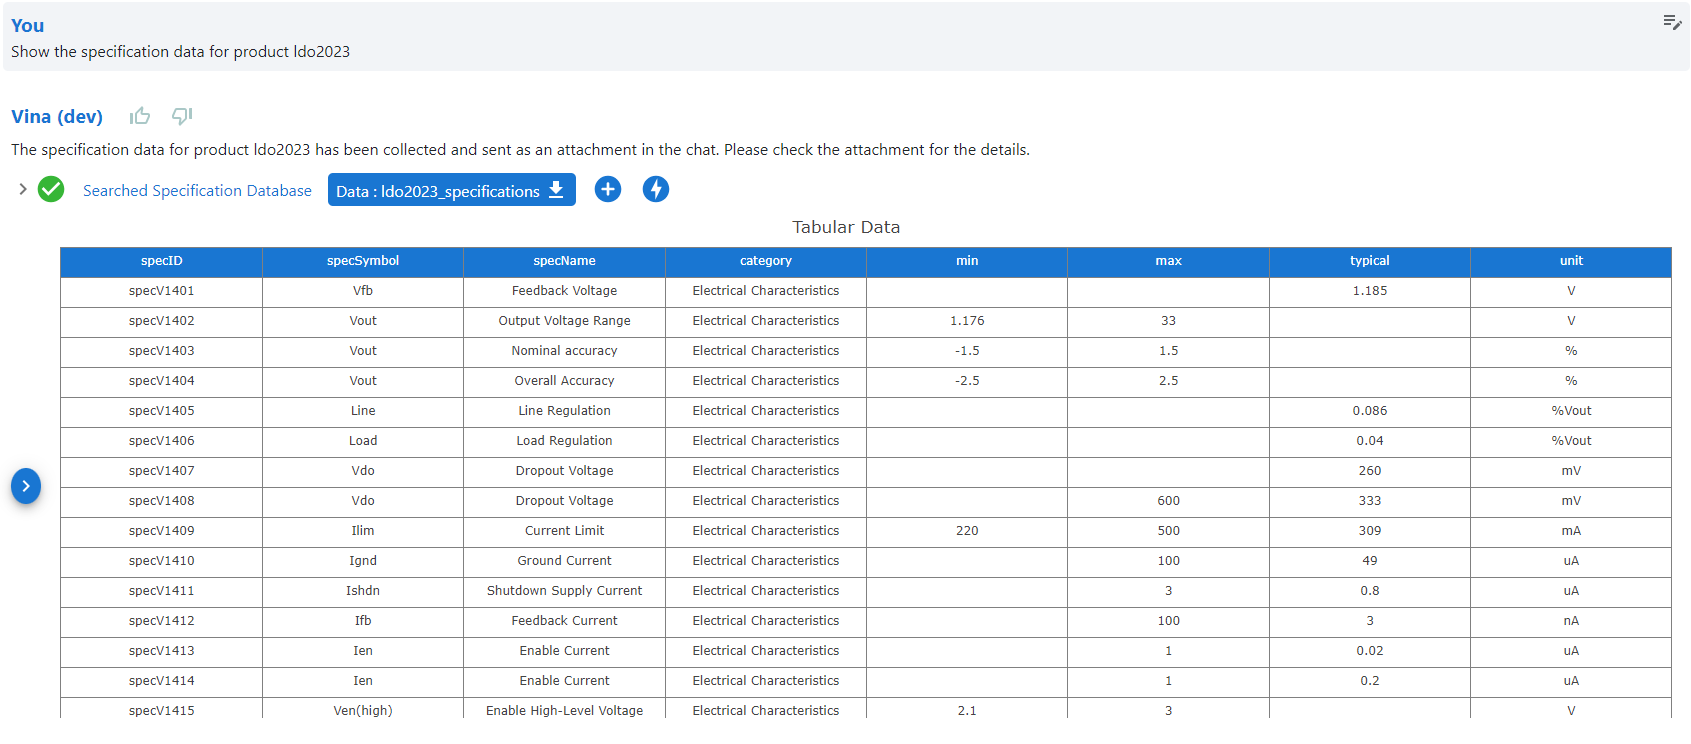 Vina generating reports from our internal data for easy inference based on user query.
Based on the user’s question in Vina regarding the data they require, the LLM identifies the right subset of data from within our data systems based specifically on the user request within just a few seconds.
Simplifying Analysis
Once LLMs can access the data within the organization, contextual answers based on user queries can easily be generated. We can also make the necessary tweaks to enhance the output to further include a display of infographics, statistics calculated from the data, predict trends, and display the data in preferred charts & plots, in addition to performing analytics that helps in simplifying analysis and gathering insights. All the above can be achieved without the need for any code.
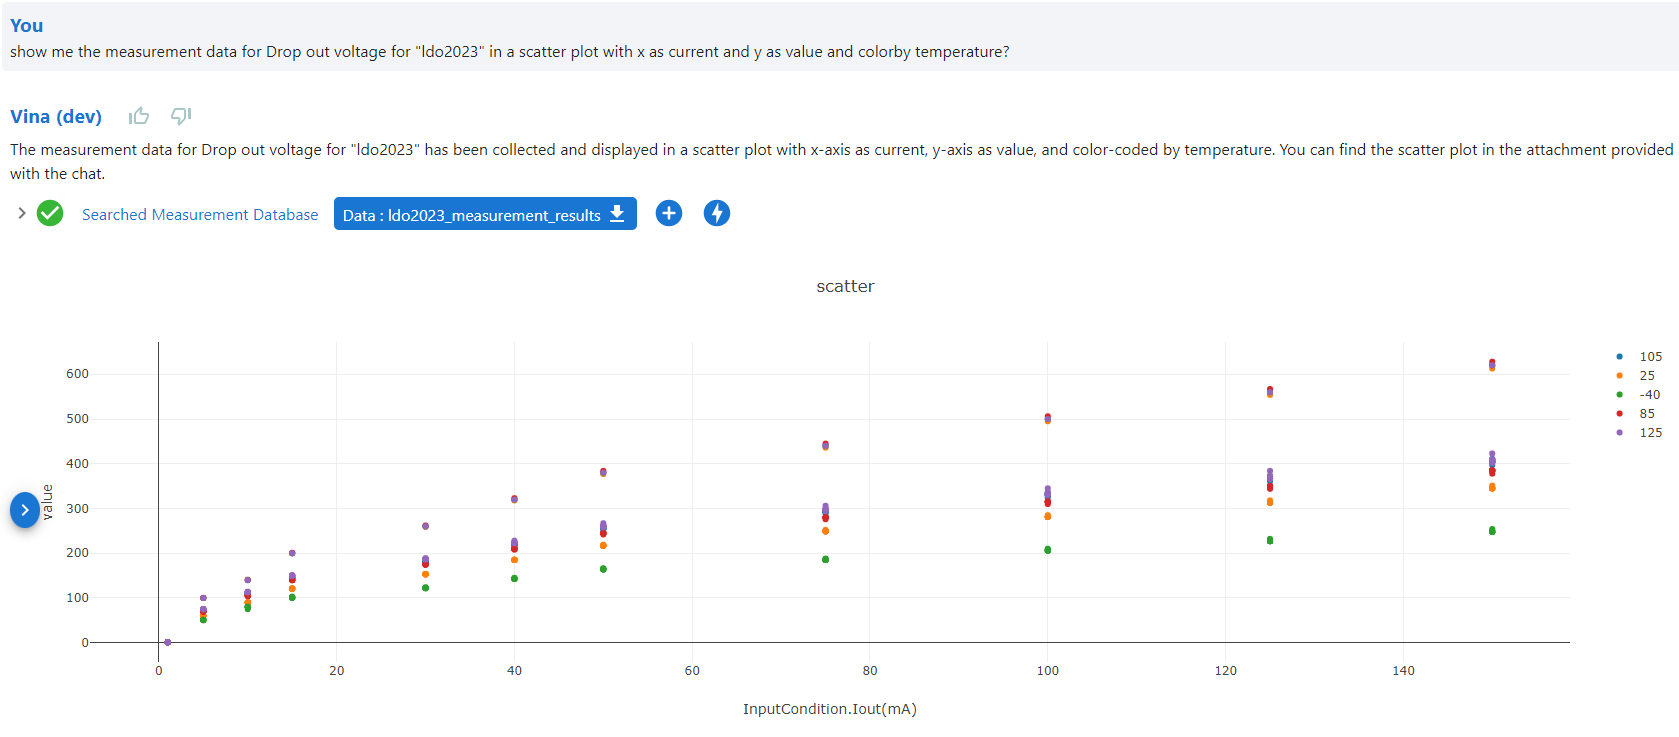 Visualizing the Data based on User Request
Generating Reports
LLMs also excel in extracting insights from large datasets and compiling the insights into comprehensive user reports such as PDFs and presentations, that convey & represent the data effortlessly in a narrative, statistical, and visual manner. This helps simplify & streamline the report creation process by communicating findings, sharing results, and helping make data-driven decisions.
Stay Tuned for More Blogs and Applications on AI
We not only guide you on how to do it, but we also show you how it’s done.
Measurement Data Analysis can seem like a daunting task at first, but with the incorporation of generative AI, the process can be simplified into an effortless procedure saving considerable time, effort, and investment.
Reach out to us at [email protected] for a more in-depth demo & discussion on simplifying analysis and insight generation from your measurement data. Click here to read our blogs offering in-depth insights on how AI can transform test & measurement workflows!